
April fooled the bulls
April is often a positive month for equity bulls, but this year the month delivered negative returns for most developed market equities as the combination of reaccelerating inflation, lower earnings and higher-for-longer interest rate concerns came to the fore.
The sell-off was quite abrupt, smashing through 50-day moving averages and, in some cases, breaching 100-day moving averages. In the US, the tech-heavy Nasdaq index lost over USD 1.3 trillion in a single week, while in Australia the ASX 200’s sell-off reduced year-to-date price returns to barely positive.
Figure 1. Nasdaq market cap and weekly change
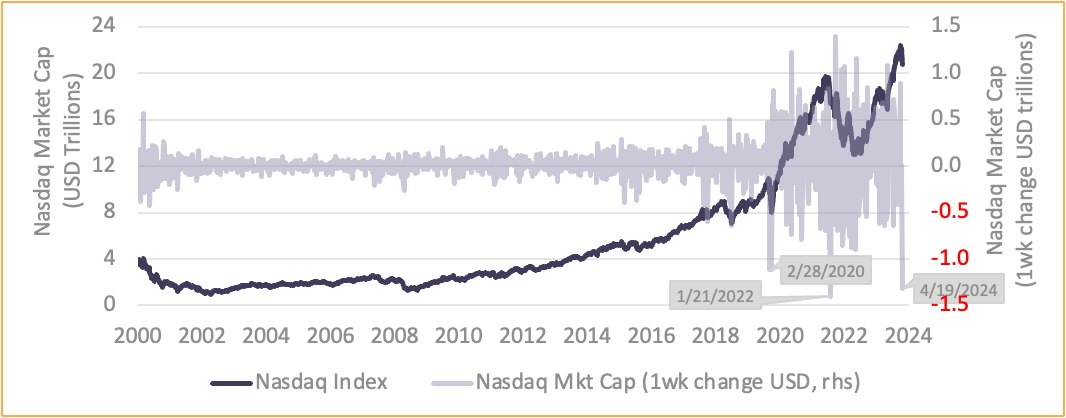
Source: Human Financial, Bloomberg
Now, one week doesn’t represent a trend, but we do believe that two forces are emerging simultaneously. Inflation is no longer falling and despite headlines that suggest otherwise, hitherto steadfast US corporate earnings are looking unsteady.
Growth in US corporate earnings has started to flatline, currently flashing 0% change over the past 12 months. Meanwhile concentration continues to increase, with the ‘Magnificent 7’ starting to look more like the ‘Fabulous 4’, while the remaining 493 companies in the S&P 500 are showing negative aggregate growth in earnings.
Looking at S&P 500 performance in more detail, some interesting insights emerge from an analysis of constituent Growth vs Value stocks.
It’s clear that earnings per share (EPS) has rapidly converged, with both Growth and Value indices now delivering almost the same number. While that isn’t uncommon from a historical perspective, what is unusual is the 12-month change of the two earnings measures, which have moved in opposite directions: Value earnings have increased 19% while Growth earnings have fallen 20%.
Growth companies that aren’t growing… therein lies a problem.
Figure 2. S&P 500 growth and value trailing earnings
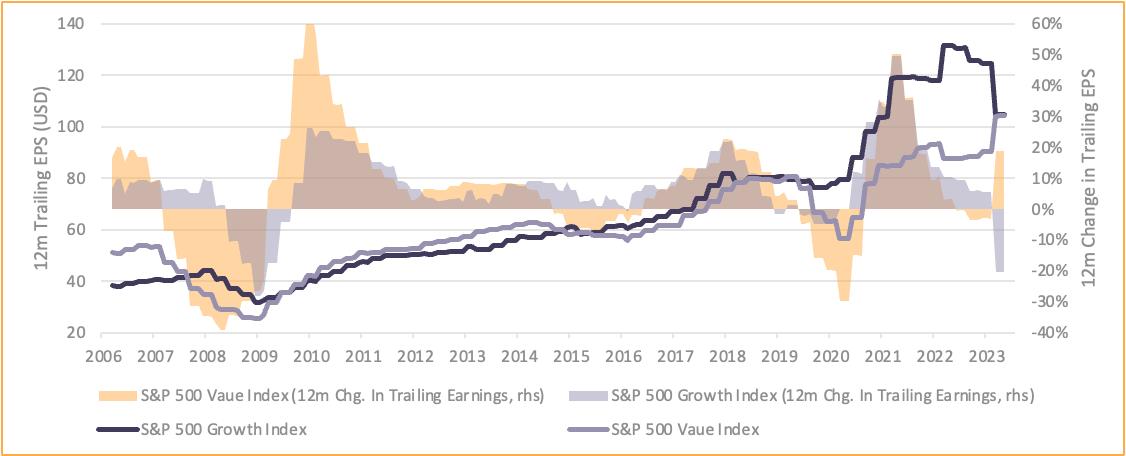
Source: Human Financial, Bloomberg
Inflation has sticky fingers
While US inflation has certainly been lower, and it is more than likely that we have seen the worst of it, this has to be understood against market expectations for a swift and continued march lower towards the magical Fed 2% policy objective.
There are many inflation indices for data mining, but in Figures 3 and 4 we use headline CPI indices, as these best reflect what the consumer is experiencing. Since June 2023 inflation has moved sideways and the latest set of numbers saw a reacceleration to 3.5%, a new 6-month high, and up from 3.1% in January.
It’s not only the level of inflation that is moving in an unhelpful direction. Inflation surprises (which signal the direction and magnitude of unexpected movements versus expectations) have also rebounded, reaching their highest level since the GFC (outside the post COVID period of 2021-23 spike). This suggests that inflation is likely to remain uncomfortably elevated. As we’ve discussed previously, this will hamper central bankers’ ability to lower interest rates in the near term, both in Australia and abroad.
Figures 3 & 4. US & Australian inflation levels and surprises

Source: Human Financial, Citi, Bloomberg (vertical axis cutoff for formatting purposes)
Expensive equities
One relative valuation measure combines the impact of higher interest rates and slowing earnings: equity risk premium (ERP) (see Figure 5). It shows the additional yield an investor achieves by investing in equities versus cash. In both Australia and the US equities are expensive, but this is most pronounced in US markets, where not only is the ERP at a multi-decade low, it’s negative!
When the ERP is low or negative, history tells us the outcome for equities is skewed downwards.
Will the near future be any different? We don’t believe so: therefore, we continue to champion the preservation of capital within our Dynamic strategies, remaining underweight equities especially in the US and Australia.
Figure 5. S&P 500 equity risk premium (earnings yield – 3m interest rate)
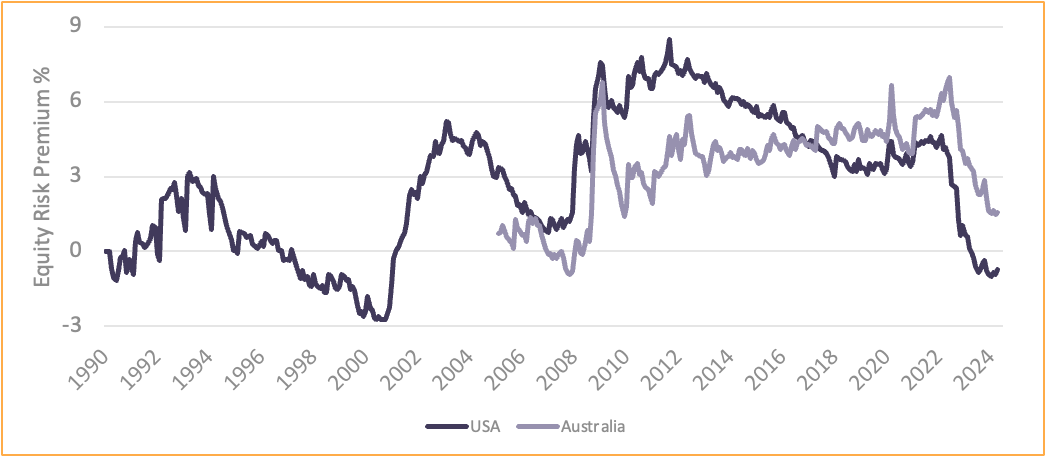
Source: Human Financial, Bloomberg